Debugging a simple GWT Java project.
Debug
Debug the web application by creating a launcher for it. This can be done by going to the GWT launcher shortcuts.
Start by creating a launcher for the applicaiton. Or reuse a previously created launcher. 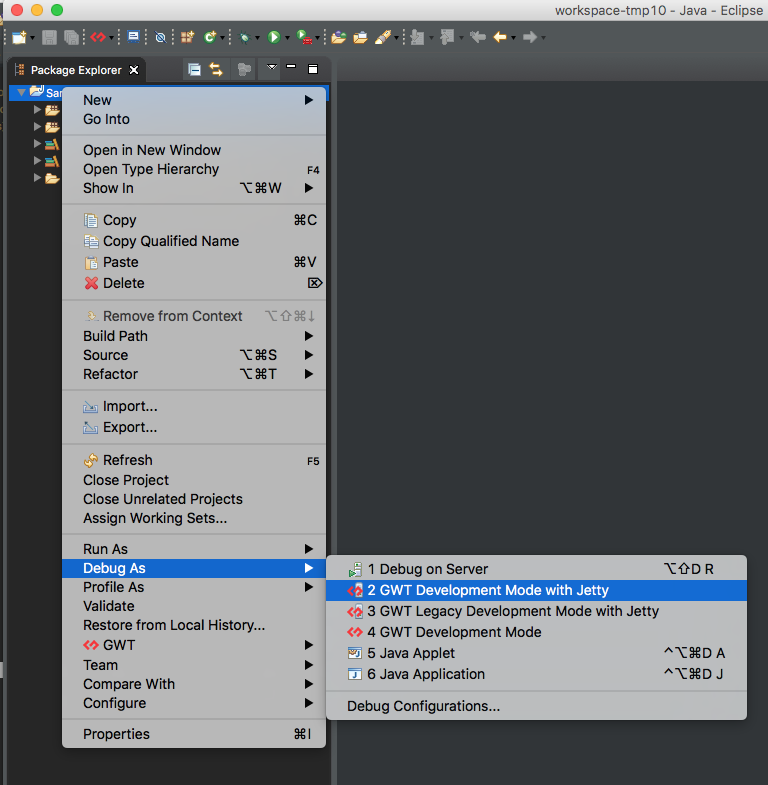
The Console view will log the CodeServer output. 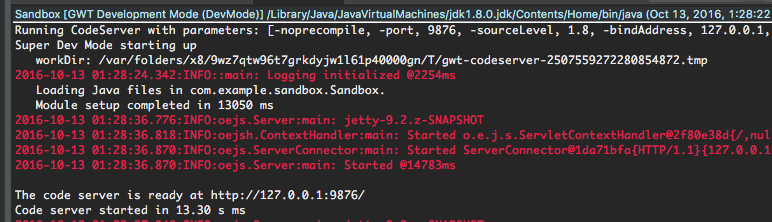
Then the Dev Mode view will focus. Right click ont he bookmark and select Open with SDBG Chrome JS Debugger the first time you start. Opening with the Javascript Debugger will allow you to see the browser logging in the IDE and use breakpoints.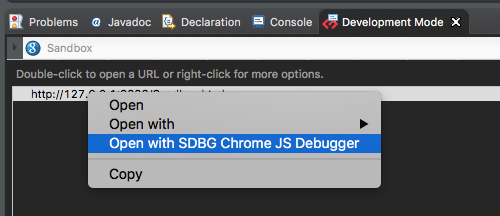
Then the Chrome browser will open and send a request to the CodeServer to start to compile. 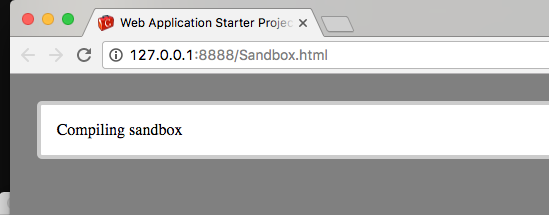
Change
Make a modification to the application then reload the changes in the browser by clicking on the Chrome refresh button.
Instead of right clicking on the URL, double click to reopen Chrome with Javascript Debugger. 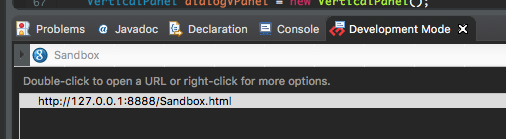
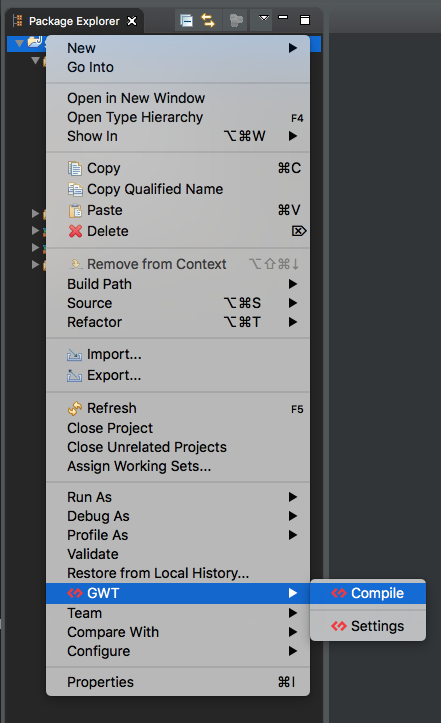
Compile
Compile by right clicking on the project and going to the GWT menus.